← Back to projects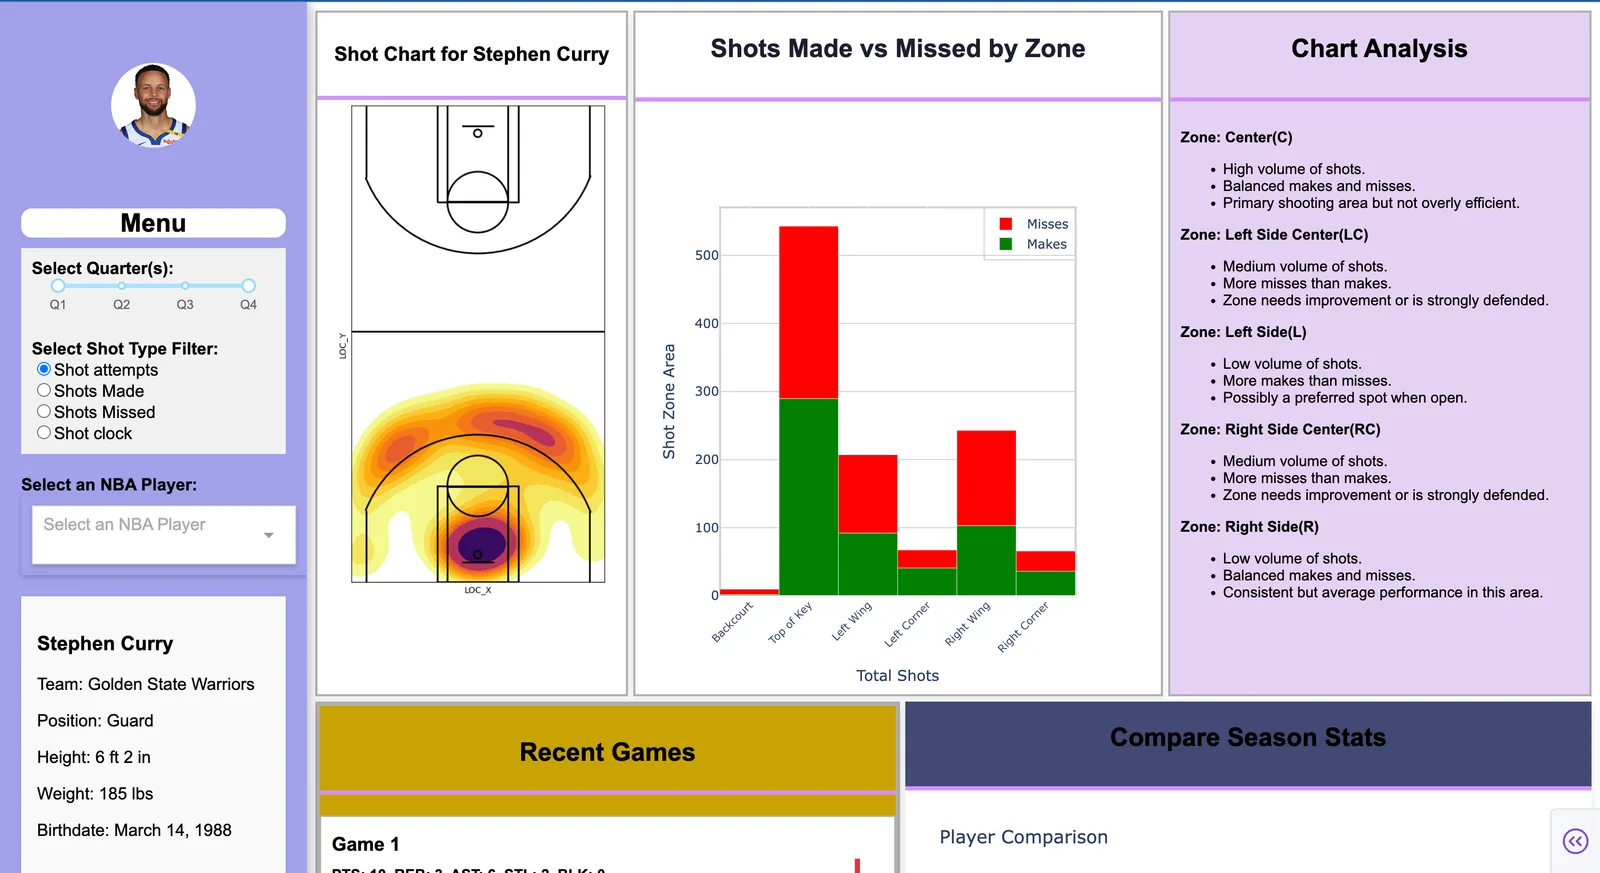
Case study
NBA Shooting Dashboard
An interactive dashboard for analyzing NBA player shooting and season statistics.
Context
Overview
A Python analytics dashboard built with Dash, Pandas, Matplotlib, and Seaborn for exploring current-season NBA shooting stats.
At a glance
Product
An interactive dashboard for analyzing NBA player shooting and season statistics.
Audience / need
Season shooting trends are easier to understand with interactive charts than static tables.
Ownership
Developer
Product
Core product flow
- Interactive season statistics exploration
- Python visualization stack with Dash
Tools
Technology stack
- Backend
- Python
- Other
- Pandas · Matplotlib · Seaborn · Dash
Visuals
Additional screenshots